
Data Preparation
Covers the multistage data preparation pipeline: feature extraction, data type portability, cleaning (missing values, normalization), and data reduction techniques including sampling, feature selection, and dimensionality reduction.
When collecting data we have issues where real datapoints are missing, inconsistent or erroneous. We need to process the data in a phase called data preparation which useful features need to be extracted from those different data sources
It is formed by a multistage process:
- Feature extraction and portability: There may be different data origins, we need to have a single "format" where each source can be converted to, and this is the data that will be stored in the database.
- Data cleaning: missing, erroneous and inconsistent entries must be removed from the data to prevent errors in the analysis. Missing entries may be estimated with a process called imputation
- Data reduction, selection and transformation: we might want to reduce the size of the data that we analyze to improve the computational efficiency and quality of the mining process, though:
- data subset selection
- feature subset selection
- data transformation
Feature extraction and portability
- When data is in a raw, unstructured form, like text or sensor signals, the relevant features need to be directly extracted for processing
- When a feature is represented in a heterogeneous way, it needs to be converted in a single uniform representation
- Feature extraction is related to the concept of data type portability
Feature extraction by domain
- Sensor data: low level signals can be converted to higher level features using wavelets or fourier transforms
- Image data: is represented as pixels, it could be converted to a higher level using histograms, the distribution of colors, etc...
- Web logs: they have a specific format in a text form, they can be converted in a multidimensional representation of categorial and numeric attributes
- Network traffic: the characteristics can be extracted, like the number of bytes transferred, the protocol used, etc...
- Document/text data: available in a raw and unstructured form of text, it contains linguistic relationships between entities. One feature extraction would be to remove stop words, stem the data and collect the words that are used in the text, as a "dictionary" of words.
Data type portability
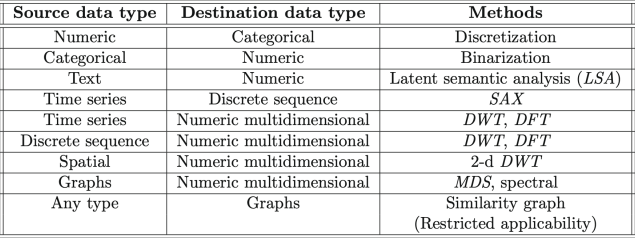
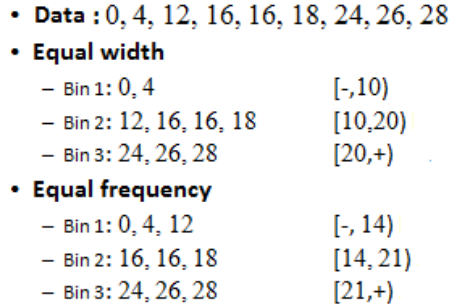
Numeric to Categorical data: Discretization
The process of discretization divides the numeric ranges into categorical ranges, going from 1 to depending on the range where the original attribute lies The discretization process can be performed in various ways:
- Equi-width(log) ranges: each range
[a,b]is chosen in such way that or is the same for each range. This works only on data sets that are distributed uniformly across the ranges. the[min, max]values are found and then divided in ranges of equal length. The equi-log is useful when attributes have exponential distribution - Equi-depth ranges (equi frequency): the ranges are selected so that each range has an equal number of records. The records are first sorted then split into groups of equal length
Categorical to numeric data: binarization
if a categorical attribute has different values, then binary attributes must be created, with each binary attribute corresponding to a possible value of that categorical attribute. In a single record, only one of the attributes take the value of 1, the rest take the value of 0 
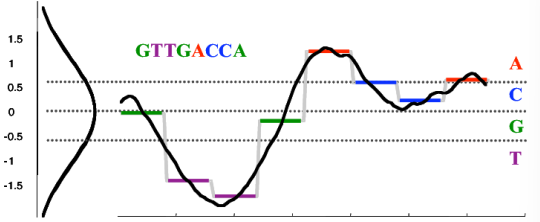
Time series to discreate sequence data
Time series can be converted to a discreate sequence using the SAX approach (Symbolic aggregate approximation), which has two steps:
- Window based averaging: The series is divided in windows of length and the average value inside this window is computed
- Value based discretization: The already averaged time-series values are discretized into a smaller number of "approximately" equi-depth intervals
Time series (Signal) to Numeric Data
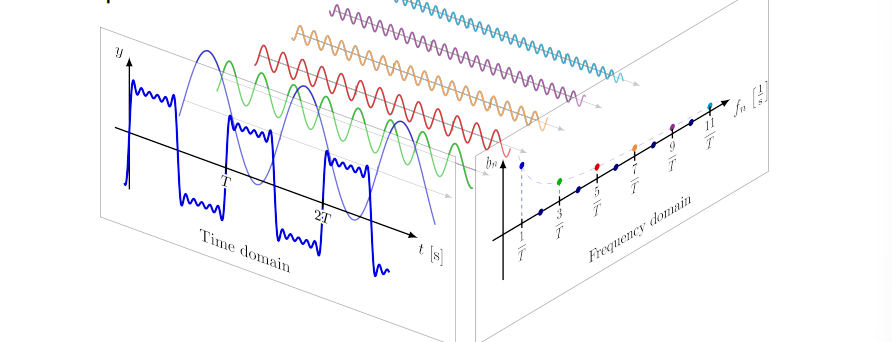
A common method for this conversion is the Fourier transform and discreate wavelet transform (DWT)
Fourier transform
Discrete wavelet transform
It decomposes a signal into it's constituent wavelets, which are small waves that can be recombined together to form the original signal
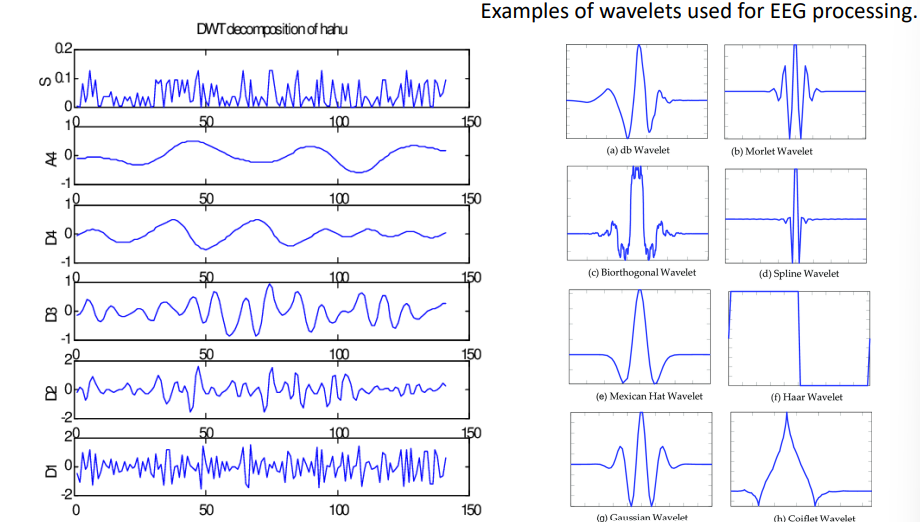 The transformation is performed by:
- Convert the discrete sequence into a set of binary time series, where the number of time series in the set is equal to the number of distinct symbols
- Map each of the time series into a multi dimensional vector using the wavelet/furier transform
- The features from the different series are combined to create a single multi dimensional record
Data cleaning
Typical sources of error are:
- data collection technologies that have a margin of inaccuracy (hardware)
- users may not want to specify some values for privacy reasons, or intentionally provide incorrect values
- manual errors in data entry
- collecting some data for some records is too expensive We need to handle different aspects of the data cleaning process:
- Handling missing entries: Estimating missing entries, also called imputation
- Handling incorrect entries: When we know the range/expected value of a field, from multiple sources, inconsistencies may be detected
- Scaling and normalization: The data might be expressed in different scales, for example the average salary based off the age
Handling missing entries
There are three techniques to handle missing entries:
- Data containing missing entries might be eliminated entirely, this approach may be impractical when most records have missing entries
- Missing values could be estimated or imputed, errors created by imputation might affect the result of the data mining algorithm
- The analytical phase is designed to work with missing values, this approach is the most desirable because it avoids biases from the imputation process
Handling incorrect and inconsistent entries
- Inconsistency detection: this is typically done when the data is available from different sources in different formats
- Domain knowledge: A domain knowledge is available to determine the valid ranges or values between attributes
- Data centric methods: The statistical behavior of the data is used to detect outliers, this method could remove useful knowledge
Normalization and scaling
Different feature represent different scales/magnitude and may not be comparable to one another, as a result, any aggregate function which is computed on the different features, will be dominated by the attribute of the one with the larger magnitude (for example, if we have 100 values with value 1 and one with value 1 million, the average will be dominated by the singular value). To solve this problem we use a technique called standardization (z-normalization): Consider the attribute, it has mean and standard derivation , then the attribute value of the record can be normalized as:
Another approach is using the min-max scaling, where the min and max values are collected from the dataset and then the attribute is scaled using this formula:
But this approach is not effective if the maximum and minimum values are extreme outliers, as an example, let's say an entry of "age" has a value of 800, this will cause every other entry to be scaled down significantly
Data reduction and transformation
The reduction of data (with loss of information) can be done on the number of rows (records), and the number of columns (dimensions) Different types of data reduction are applied in different applications:
- Data sampling: A subset of the original records are selected, creating a much smaller database to work with, this is harder to implement in streaming scenarios
- Feature selection: Only a subset of features from the data is used during the analytical process, so we select only the features that are necessary in our application
- Data reduction with axis rotation: We use the correlation between data to represent it in a smaller number of dimensions (PCA)
- Data reduction with type transformation: The type is reduced to a smaller size and lower complexity (example the Fourier transform)
Data sampling
- Unbiased sampling
- without replacement: from a dataset with records, a total of records are randomly picked from the data
- with replacement: from a dataset with records, the records are sampled sequentially and independently from the entire dataset a total of times
- Biased sampling: some data might be intentionally emphasized because of their greater importance to the analysis
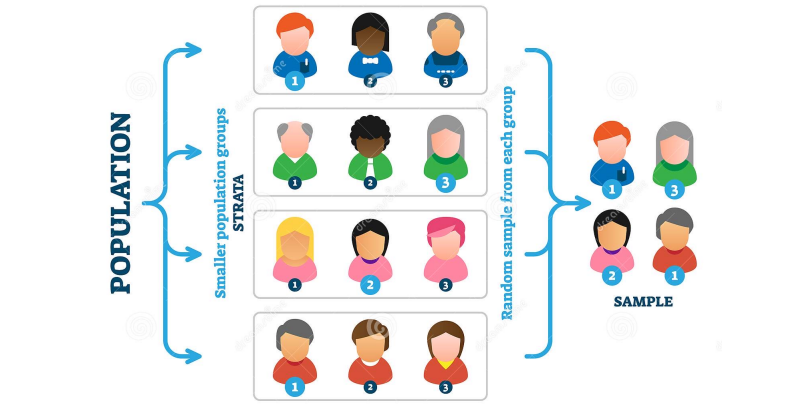
- Stratified sampling: we might want to keep some specific info that doesn't occur frequently, and that would get lost with the sampling, with this technique we first partition the data in a set of desired , and then is independently sampled from each of these strata, based on predefined application specific proportions
Reservoir sampling for data streams
In reservoir sampling, a sample of points is dynamically maintained from a data stream, the probability of a data point to be in the sample is where is the sample size, and is the number of points in the data set, but in this case, the data set is not static and cannot be stored in disk.
Initially, the first elements of the stream are used to initialize the reservoir, then, for each incoming data point, we insert the item with probability , swapping it out with a random element in the sample window
Feature subset selection
There are two primary types of task dependent feature subset selection:
- unsupervised feature selection: We remove the noisy or redundant attributes from the data, this has a big effect on the clustering application
- supervised feature selection: This is relevant to data classification, only the features that can predict the class attribute effectively are the most relevant, so we get rid of the rest
Dimensionality reduction with axis rotation
In a real dataset, many correlations exist among the different attributes, so we can exclude or merge the dimensions
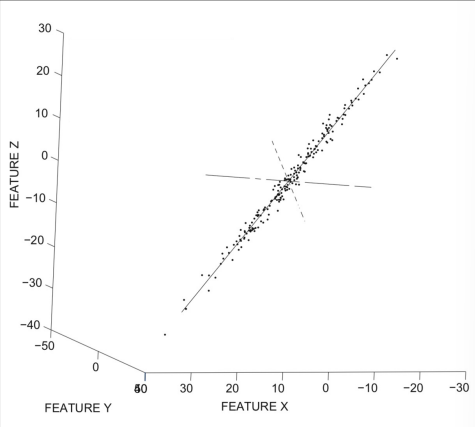 For example in this 3 dimensional data set, most of the interest lies on a single dimension (the line), so we could approximately represent it as a 1 dimensional data set